The authors were both involved in preparing the Maastricht summit and examine the arithmetic of the Maastricht reference values in relation to the macroeconomic facts as of today. Broader questions to do with fiscal architecture and institutional design will be addressed in a subsequent column.
The Maastricht fiscal architecture relies on limits on debt and the
general government deficit. The reference values used are 3% for the
deficit and 60% for the debt, both in terms of GDP. These reference
values are not specified in the body of the Treaty. Instead, they are
defined in an annexed Protocol. The expression “reference values” is
used six times when defining the two criteria to be used by the European
Commission when monitoring developments of public finances, with a view
to identifying “gross errors” in the conduct of fiscal policy. These
two reference values have no solid ground in either theory or empirical
evidence. No such a claim was made at the time (or ever).
To our recollection, the first reference value agreed was the
debt-to-GDP ratio of 60%. It was a value close to the average of the
negotiating countries at the time (see Figure 1).1 In the
five years up to 1989, the simple average of the debt-to-GDP ratio of
the 12 countries negotiating the Treaty was almost exactly 60%.
The debt criterion did not impose 60% as an absolute limit. Instead,
it specified that if the debt-to-GDP ratio exceeds 60%, it should be
sufficiently diminishing and approaching the reference value at a
satisfactory pace. The idea is that, even if the public debt-to-GDP
ratio is elevated, public finances are under control if this ratio is
moving in the right direction and the reference value is getting closer
fast enough. Such formulation was also necessary for political reasons.
Some countries (Belgium, Ireland, and Italy) had debt-to-GDP ratios
close to (or above) 100% of GDP at the time, and therefore a 60%
absolute limit could not be respected anytime soon. Since the absence of
an excessive deficit was one of the convergence criteria for
participation in monetary union this question was very salient from a
political viewpoint.
A very simple equation helps to understand the compatibility of the reference values for debt and deficit:
∆b = d – gb
where Δ is the change operator; b is the debt-to-GDP ratio; d is the overall deficit in percent of GDP; and g is the growth of nominal GDP. In turn, g
can be expressed (approximately) as the sum of the growth of real GDP
and inflation. At the time, a reasonable assumption for nominal GDP
growth was 5%. That corresponded to a real growth of 3% (or more) and a
norm for price stability requiring inflation below 2%. With the overall
deficit at 3% the debt-to-GDP ratio would be invariant at 60% of GDP
(see Figure 2, Scenario 1). With debt-to-GDP at bhigh>60% an overall
deficit of 3% implies a declining public debt-to-GDP ratio.
Specifically, it implies:
∆b = -0.05 × (bhigh – 60)
which was not used specifically in the Treaty but may be used to
rationalise the 1/20th rule that was introduced many years after. It can
also be used to elucidate the meaning of the qualifying clause
“sufficiently diminishing and approaching the reference value at a
satisfactory pace.”
The Member States committed to a budget position of close to balance
or in surplus in the context of the Stability and Growth Pact of 1997.
Under such constraint the long run level of the public debt-to-GDP ratio
would be close to zero. The expectation would be that the debt-to-GDP
ratio would approximate such a value at a rate of about 1/20th of the
gap per annum. As is clear from the argument above, if nominal GDP grows
at 5%, a balanced budget implies a much faster fall in the debt-to-GDP
ratio than implied by the 1/20th rule.
The close to balance or surplus requirement also allowed for the 3%
ceiling to be respected in most circumstances. The exceptions include
catastrophes and deep or prolonged slumps. In other words, a balanced
budget position is compatible with the full functioning of automatic
stabilisers over the course of a normal business cycle, while respecting
the 3% deficit ceiling.
The relationship between the main macroeconomic variables is very
different today. Much has been made of the coincidence of very high debt
levels with very low nominal interest rates. For example, for Italy in
1980, public debt was at 56% of GDP; interest payments on the budget
amounted to 4.4% of GDP. During the 1980s, interest payments more than
doubled as a percentage of GDP. In the first half of 1990s, they reached
double digits with a peak at 12.3% of GDP in 1993. Debt ratios also
more than doubled during this period; the peak was in 1994 with 130.3%
of GDP. In 2020, 40 years on, the debt-to-GDP was at about 155% of GDP.
But interest payments on budget are projected to be substantially lower
at 3.5% of GDP. The main change was disinflation. Inflation was above
20% in Italy in 1980. In 2019, the year before the pandemic crisis,
inflation was barely positive (0.6%).
The key features of the Italian data just described can also be seen,
qualitatively, in the set of 12 countries originally negotiating in
Maastricht – namely, substantial increases in debt during the 1980s and
early 1990s, followed by decreases in interest payments, in inflation,
and in GDP growth (see Figure 1).
Figure 1 Public debt and interest rates (Maastricht 12)
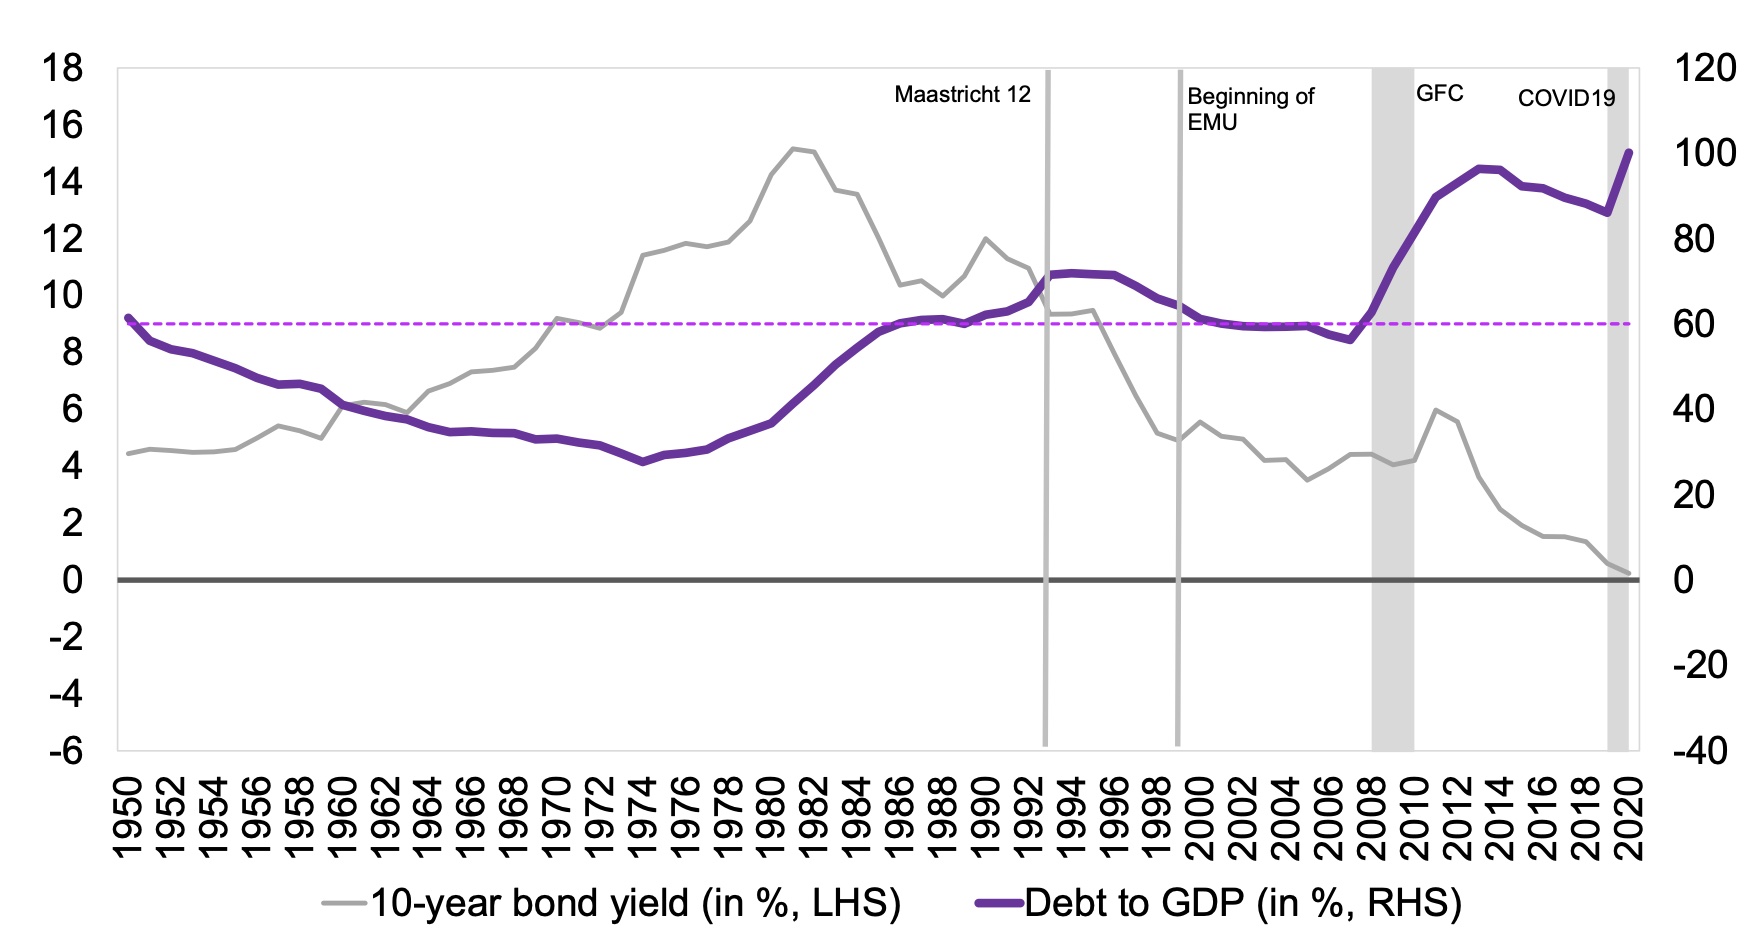
Today, debt-to-GDP in the same group of countries, the Maastricht 12, is about 100%.
Throughout this column, we focus on the Maastricht 12 countries to
keep the analysis simple (avoiding, for example, the complications of
the changes over time in the composition of the euro area). Nominal
growth in recent times has also been substantially lower than 5% on
average, hovering around 3% for this group. Arithmetically, with these
values a 3% deficit would stabilise debt at around the current levels of
100% and the gap relative to that level would be closed by 3% a year.
The consistency imposed by the arithmetic of debt accumulation may be
read from left to right on Figure 2. But it is also illuminating to
examine the converse link – from deficits to debt.
Figure 2 Debt, growth, and debt-stabilising deficits
The Maastricht Treaty set the 3% as a reference value. The Stability
and Growth Pact hardened the requirement by setting the 3% as a hard
ceiling, respect of which would require a broadly balanced budget in
normal times to allow a free playing of automatic stabilisers in bad
times. In the end, empirical analyses at the IMF confirm that the 3% has
been a salient focal point for fiscal policy, by acting as a ‘magnet’
and hence reducing the occurrence of both large government deficits and
surpluses (Caselli and Wingender 2018). As such, it had a disciplining
effect on fiscal behaviour, but has not led to the creation of
sufficient room for manoeuvre in good times, thereby helping only partly
to correct the inherent pro-cyclical bias in fiscal behaviour. This
shortcoming will be even more relevant in the future given the lower
nominal growth and the expected larger role of fiscal policy in
responding to shocks....
more at Vox
© VoxEU.org
Key

Hover over the blue highlighted
text to view the acronym meaning

Hover
over these icons for more information

Comments:
No Comments for this Article