
|
|
Since mid-2022 the Eurosystem’s balance sheet declined by around €2,000 billion, or more than 22 per cent. The largest part of this decline is due to banks having repaid a substantial share of the loans taken from the Eurosystem via the targeted long-term refinancing operations. This has released many assets previously used as collateral back to the market, including government bonds. Moreover, the Eurosystem owns smaller amounts of bonds since it no longer reinvests maturing bonds under its asset purchase programme.
The reduction of the Eurosystem’s balance sheet and the fact that governments across the euro area have issued record amounts of debt have substantially increased the availability of bonds to the market. This has helped to bring the Eurosystem’s footprint in government bond markets closer to pre-pandemic levels (Chart 1).
But how have markets adjusted, and which other investors are stepping in to absorb the increasing amount of government bonds available to the market?
Size of euro area government bond market and the Eurosystem market footprint (EUR billions and %)
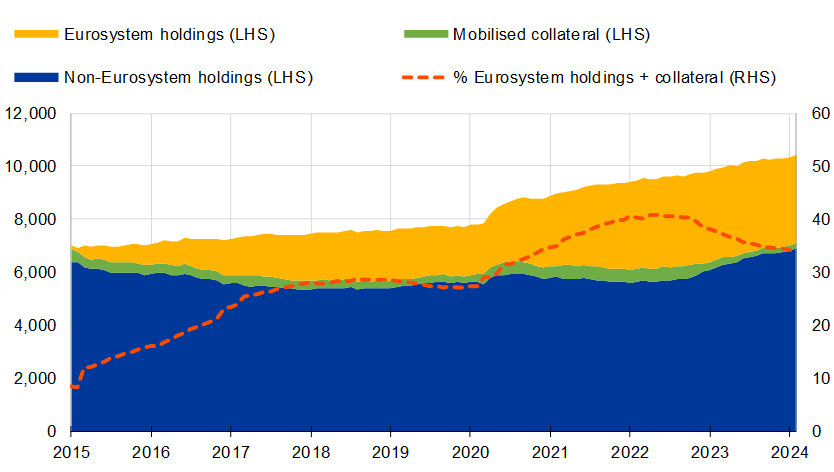
Sources: Eurosystem, CSDB.
Notes: The chart shows the evolution of the size of the euro area government bond market and splits it into the Eurosystem holdings (yellow) and mobilised collateral (green), and what is not held or mobilised as collateral with the Eurosystem (blue). The Eurosystem market footprint is a relative measure, computed as the share of the Eurosystem’s euro area government bond (EGB) holdings compared to nominal amount outstanding. Outright holdings are EGBs held by the Eurosystem via purchase programmes, adjusted with EGBs lent back via the securities lending against cash collateral facilities; mobilised collateral includes EGBs mobilised as collateral for open market operations. Last observation: 29 February 2024.
How to read the figures: In 2020 the euro area government bond market had a capitalisation of almost €8 trillion. At that time Eurosystem holdings and collateral had a value of more than €3.5 trillion, which accounted for 31.5 percent of the market.
Chart 2 shows that various types of investors have stepped in and compensated for the Eurosystem’s reduced presence. While the Eurosystem has not actively sold bonds, it only partially replaced maturing bonds in its monetary policy portfolios[2]. Two sectors have clearly contributed the most to absorbing the new debt since the Eurosystem began to reduce its balance sheet: households and foreign investors.
Chart 2Sectoral absorption of government securities in 2023 (%) 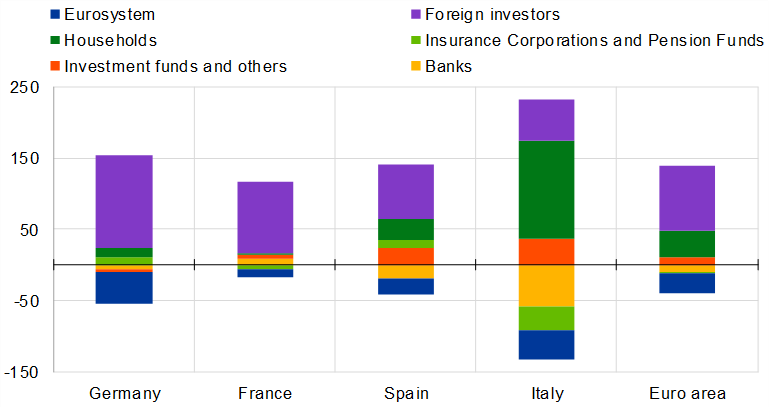
Sources: ECB, SHS. |