We analyse the effectiveness of policy tools for large-scale banking distress and draw lessons for today. The depth of recessions following banking distress depends both on the speed with which tools were deployed and their type and on the macro-financial vulnerabilities.
While, in general, swifter and broader-ranging policy actions
mitigate such recessions, central banks' asset purchases and lending are
particularly effective when banks have been underperforming or when
distress follows abnormally large asset price movements, such as those
triggered by the Covid19 crisis. Our analysis confirms that the recently
employed policies have supported the real economy.1
Banking distress and crises tend to be followed by deep recessions.
The basic reason is the sharp contraction in lending following a
breakdown in financial intermediation. Baron et al (2020) document that
after episodes of large bank stock price declines and an abnormal number
of bank failures - that is, after distress episodes - real GDP falls by
5.5% on average from peak to trough. Output losses are particularly
large when distress morphs into a full-scale banking crisis (Laeven and
Valencia (2013)). And they vary across countries. For example, during
the Great Financial Crisis (GFC) output fell from peak to trough by
0.16% in Switzerland and by almost 30% in Greece.
There are two interrelated sets of explanations for such variations
across countries and episodes. One relates to the initial economic
conditions, notably the macro-financial imbalances with which countries
enter a period of distress. For instance, banking distress associated
with the unravelling of a domestic financial imbalance (eg a housing
bubble) may have a very different impact than that stemming from an
external event in the absence of such or similar imbalances (eg a crisis
imported through cross-border exposures).2
The other set of explanations relates to the policies employed. The
timing and degree of policy activity and the specific tools deployed (eg
central bank lending, separation of impaired assets) differ
considerably across episodes. These choices will influence the severity
of the recession, not least if the effectiveness of tools varies with
the initial conditions.
Key takeaways
- Policy interventions that address banking distress also help support GDP growth.
- Central banks' asset purchases and
lending have generally been effective in supporting growth when distress
follows banks' poor performance, high private sector leverage or large
asset price corrections.
- Central banks' swift response to the
Covid-19 crisis has helped to support the economy, including by
pre-emptively staving off banking distress.
While many studies document the economic consequences of banking
distress, relatively few systematic cross-country analyses explore the
effectiveness of mitigating policy tools.3
Progress has been hamstrung by a lack of comprehensive data about these
tools. Furthermore, it is inherently difficult to measure
effectiveness. For example, larger-scale distress calls for stronger
interventions, but also makes success less certain. This may lead to the
spurious conclusion that interventions are less effective.
With this special feature, we make progress along three dimensions.
First, we classify 62 banking distress episodes into five categories, on
the basis of initial macro-financial vulnerabilities.4
Second, using a new database by Adler and Boissay (2020) on the
deployment of various distress mitigation tools, we assess empirically
whether variations in the evolution of GDP across similar episodes can
be explained by differences in the speed and type of policy
interventions. Third, we draw policy lessons for today from our
analysis.
We find that swifter and broader-ranging policy actions mitigate the
impact of banking distress on economic activity. We refine this result
in several ways. Central bank lending schemes are more effective in
helping restore GDP growth when set up in the first year of distress,
whereas impaired asset segregation schemes are more successful when used
in the second. Asset purchase and - to a lesser degree - liability
guarantee schemes are effective regardless of when they are deployed.
Our analysis of past experiences also suggests that certain tools are
particularly effective under specific initial conditions. For example,
we find that central bank lending schemes are most helpful when distress
follows unusually large asset price corrections of the type triggered
by the Covid-19 crisis. Our results confirm that the policy measures
adopted since March 2020 have helped to support the economy, including
by pre-emptively staving off banking distress.
The rest of this feature is structured as follows. The first section
describes how we classify banking distress episodes and, in the process,
documents their variety. The second describes the various policy
interventions, and includes a box on their variation by time of use and
across countries. The third section formally tests the effectiveness of
various policy interventions depending on their speed and the type of
episode. The fourth section applies these findings to the ongoing
Covid-19 crisis. A final section concludes.
Classifying banking distress episodes
Banking distress has various causes and can start from different
initial conditions. Such differences must be accounted for when
evaluating the effectiveness of policy interventions. Our approach
consists of classifying past distress episodes into categories, based on
the macro-financial vulnerabilities that preceded them.
We consider 62 past banking distress episodes from Baron et al (2020) for 29 countries over the period 1980-2016.5
Baron et al define a distress episode as one in which bank equity
prices fall by 30% year on year and there is a higher than normal number
of bank failures. Their list differs from others' (eg Laeven and
Valencia (2012, 2018)) in two ways. First, it features more episodes,
including many distress episodes that did not end in crisis.6 Second, the starting dates of the episodes are identified precisely by crashes in bank stock prices.
In order to classify banking distress episodes, we track the
evolution of a large set of macro-financial variables in the run-up to
these episodes. There are vulnerabilities when (some of) these variables
take on abnormal values (Box A).
We classify the episodes into five categories, corresponding to five
broad vulnerability types: (V1) cross-border exposures; (V2) asset
valuations; (V3) bank health; (V4) private non-financial sector (PNFS)
leverage; and (V5) real economy performance (Graph 1, Box A
and Adler and Boissay (2020)). Vulnerabilities of the first type, for
example, typically stem from domestic residents' cross-border
liabilities in foreign currencies and cross-border bank loans (Graph 1,
left-hand panel). Those related to asset valuations show up as sharp
drops in house and stock prices (eg following the bust of an asset price
bubble). Vulnerabilities related to real economy performance manifest
themselves most often through a prior severe recession, with pronounced
falls in manufacturing PMIs and consumption growth.
Our classification highlights the variety of banking distress episodes. The right-hand panel of Graph 1
shows that in about 40% of the episodes, distress is preceded by
excessive cross-border exposure, severe asset price corrections7 or weak real economy performance. Weak bank performance only precedes 20% of the episodes.8
Box A
Definition of vulnerabilities and classification of distress episodes
This box describes how we identify the macro-financial
vulnerabilities that manifest themselves in the run-up to banking
distress episodes. We say that there is a (country-specific)
vulnerability whenever a variable takes on an "abnormally" high or low
value, ie when it falls in the upper or lower 10% tail of its
distribution. Since the immediate lead-up and aftermath of the episode
may distort the statistics, we follow Goldstein et al (2000) and
consider the distribution only for "normal times", defined as the period
that excludes the two years before and after the beginning of distress
episodes. We then investigate which variables took on abnormal values in
the distress episode's starting quarter (ie of the banks' stock price
crash), as well as the first, third and fifth quarters before that.
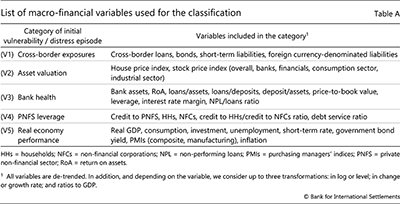
We consider a comprehensive quarterly data set of more than 70
macro-financial variables (in levels, growth rates, ratios to GDP) that
the literature has identified as potential early warning indicators of
banking distress (Table A). We group these variables into five categories relating to different
types of macro-financial vulnerabilities. This classification follows
common practice and is consistent with central banks' financial
stability monitoring frameworks.
We group these variables into five categories relating to different
types of macro-financial vulnerabilities. This classification follows
common practice and is consistent with central banks' financial
stability monitoring frameworks. Altogether, taking into account the number of variables and quarters
considered, the total number of potential vulnerabilities per category
ranges from 48 to 72, depending on the category.
Altogether, taking into account the number of variables and quarters
considered, the total number of potential vulnerabilities per category
ranges from 48 to 72, depending on the category.
To classify a distress episode, we first calculate the percentage of "abnormal" variables within a category. Then we classify an episode into a specific category if this percentage
is above a threshold of 25%. The classification is not mutually
exclusive: a given distress episode may be classified in multiple
categories. At the same time, the 25% threshold implies that three
quarters of the episodes are classified in at least one category and one
quarter of all episodes are classified as not preceded by any
vulnerability.
Then we classify an episode into a specific category if this percentage
is above a threshold of 25%. The classification is not mutually
exclusive: a given distress episode may be classified in multiple
categories. At the same time, the 25% threshold implies that three
quarters of the episodes are classified in at least one category and one
quarter of all episodes are classified as not preceded by any
vulnerability.
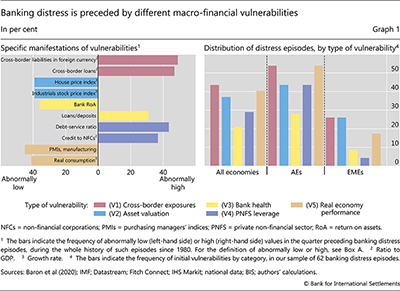
The data indicate some differences between advanced and emerging
market economies (EMEs). In advanced economies (AEs), distress episodes
tend to be preceded by widespread vulnerabilities, with notably
excessive cross-border exposure and weak economic performance (55% of
cases). In about 40% of the AE episodes, the initial conditions involve
severe asset price corrections or high private sector leverage. In EMEs,
it is harder to relate distress episodes to specific vulnerabilities.
Just one in four episodes is preceded by excess cross-border exposure or
a severe fall in asset prices, and few episodes by excess leverage,
whether in the financial or non-financial sector. This suggests that
banking distress in EMEs need not be the outcome of domestic imbalances,
but could be triggered by external shocks.....9
more at BIS
© BIS - Bank for International Settlements
Key

Hover over the blue highlighted
text to view the acronym meaning

Hover
over these icons for more information

Comments:
No Comments for this Article